As your final blog post I would like you to do a short (500-1,000 word) essay analysis of the demographics of the 2016 presidential election using the data sources below. This is due by midnight on Tuesday December 13th.
http://www.nytimes.com/interactive/2016/11/08/us/politics/election-exit-polls.html?_r=0
http://www.pewresearch.org/fact-tank/
http://www.politico.com/2016-election/results/map/president
http://www-personal.umich.edu/~mejn/election/2016/

Any analysis of the results of the U.S election purely based on demographics has little relevance in the determination of the winner based on number of individuals who voted. The result is rather skewed toward the geographic locations of the voters. The population of the states that voted Republican is on average significantly lower than that of the states that voted Democratic. In other words, voters in less populated areas valued more in determining the outcome of the elections than their compatriots living in densely populated areas in the 2016 presidential elections. In fact, the number of Electoral College votes won by Donald Trump (306) corresponds to ~2.7 Million votes lesser than Hillary Clinton’s 232 Electoral College votes (http://www.politico.com/2016-election/results/map/president). However, it would be an erroneous oversimplification to try to understand the complex process of American elections –the most extensive, the lengthiest and the most expensive process in the world—by basing it purely on the geographic divide as well. Therefore, a number of factors such as race, economy, education, and persona of the candidates should be evaluated. Such an analysis would also help understand why a few traditionally democratic states voted Republican in the 2016 presidential elections.
The statistics published by New York Times (http://www.nytimes.com/interactive/2016/11/08/us/politics/election-exit-polls.html?_r=0) provides a cross-section of the voting pattern. According to these stats, both candidates were recognized by their campaign messages in the polling booths. While Hillary Clinton performed strongly among female voters, young voters, non-white voters, LGBTs and urbanites, Donald Trump outperformed her among male voters, older voters, white voters, evangelicals and rural voters. In addition, the economic message of Hillary Clinton resonated well with the lower income voters. The middle class voters have favored Donald Trump strongly, as also revealed by data from Pew Research center. Donald Trump is also favored by the upper middle class voters. On the education front, college graduates have favored Hillary Clinton slightly but it is eclipsed by the higher number of white college graduates strongly favoring Donald Trump. Therefore, the demographics of voting pattern have closely followed what the election experts had predicted for Hillary Clinton; for example, in the wake of Donald Trump’s rhetoric on immigration, minorities, the physically challenged, and Muslims, it was widely predicted that Hillary Clinton will perform strongly among voters of these populace. However, the prediction that the college educated white women would vote strongly in favor of Clinton failed to materialize.
Pew Research Center analysis (http://www.pewresearch.org/fact-tank/2016/12/08/gop-gained-ground-in-middle-class-communities-in-2016/#more-285599) concludes that White voters preferred Trump over Clinton by 21 percentage points (58% to 37%), according to the exit poll conducted by Edison Research for the National Election Pool. Women supported Clinton over Trump by 54% to 42%. This is about the same as the Democratic advantage among women in 2012 (55% Obama vs. 44% Romney) and 2008 (56% Obama vs. 43% McCain). Among whites, Trump won an overwhelming share of those without a college degree; and among white college graduates – a group that many identified as key for a potential Clinton victory – Trump outperformed Clinton by a narrow 4-point margin.
Pew Research Findings also record deep inroads into America’s middle-class communities in 2016 by the Republican Party. Although many middle-class areas voted for Barack Obama in 2008, they overwhelmingly favored Donald Trump in 2016, a shift that was a key to his victory. Overall, Democrats experienced widespread erosion in support from 2008 to 2016. Their share of the vote fell in 196 of the 221 metropolitan areas examined.
Analyses of different aspects of Elections 2016 reveal that both party’s affiliates largely voted for their candidate irrespective of the revelations related to the misogynistic views of one candidate or the emails of the other. However, it would be hard to conclude if such revelations did or did not significantly impact the voting desires of the independent individuals. Overall, comparisons and contrasts of voting patterns of previous election cycles indicate that either candidate performed well in their home turf except that Clinton yielded to Trump in three traditionally democratic states while still maintaining a modest lead in popular votes.
Very good analysis
The outcome of the 2016 Presidential election came as a shock to many, as the national narrative in the media (for better or for worse) was that the election was Hillary Clinton’s to lose. Ultimately, the underdog Donald Trump was able to win the election by demographics by drastically improving upon Mitt Romney’s performance across many demographic groups, as revealed by exit poll data. One of the most interesting demographics in the exit poll data is that of gender. Considering Hillary Clinton’s history-making candidacy and Donald Trump’s less than stellar reputation with women, many expected that women would overwhelmingly favor Hillary Clinton. While women did favor Hillary overall, there was only a 1% improvement over President Obama’s performance with women in 2012. Furthermore, a majority of men favored Donald Trump, swinging 5% in his favor compared to Mitt Romney in 2012. There could be several explanations for this. Perhaps American men are simply not ready to elect a woman president, which would be a quite sad description of 21st century America. Or, it could be that they did not want to elect this specific woman to be president – it would be interesting to see how the male vote would split in an election between a female Republican candidate and a male Democratic candidate. Perhaps 2024 will give us that opportunity.
Race is another interesting factor to consider in the 2016 presidential election. The rhetoric of the campaign certainly led most people to believe that minorities overwhelmingly favored the Clinton campaign, and they did, but Donald Trump actually made significant inroads with several minority groups, including African Americans and Latinos. The Latino numbers are, for me, the most surprising out of everything. Exit polls showed that 29% of Latinos supported Donald Trump, a candidate who began his campaign by calling Mexicans rapists and criminals and whose primary policy on the campaign trail was building a wall along the U.S.-Mexico border to replace the fence that currently runs along much of the border. Despite this, Trump was able to do 8% better among Latino voters than Mitt Romney did in 2012. He made a similar improvement with African Americans, but the overall share of African Americans who voted for Trump was much smaller, at 8%. Hillary Clinton needed to do at least as well among minorities as President Obama did in 2012, and she simply was not able to achieve that.
A final demographic group to investigate is the LGBTQ community. While Hillary Clinton did improve significantly over President Obama’s performance in 2012, likely due to the major progress made in LGBTQ rights during his second term (i.e., Obergefell v. Hodges), 14% of LGBTQ voters supported Donald Trump. While it was difficult to understand the motivation of Latino Trump supporters due to the candidate’s actions, it was difficult to understand the motivation of LGBTQ Trump supporters due to the Republican Party’s actions. The GOP has long made so-called ‘family-values’ (i.e., heterosexual marriage) a top priority, demonized LGBTQ individuals, and deprived them of their basic civil rights. While Trump made some attempts to appeal to the LGBTQ community, his appeal seemed insincere at best (for example, the time he held a pride flag upside down at a campaign event).
Finally, it is important to remember that while exit polls can be useful, they also have inherent limitations. Exit poll data is obtained from a sample of polling places on election day (and sometimes additionally through telephone surveys to account for early and absentee voters). Individuals can choose whether or not to participate in the survey, making non-response bias a potential issue. At least one experiment conducted also found that the stated sponsor of the exit poll can influence individuals’ decisions to participate (Panagopoulos 2016).
Panagopoulos, Costas. 2016. “Exit Poll Sponsorship and Response Intentions.” Journal of Politics and Law 9(4): 72–77.
Excellent
The demographics of the 2016 election have represented several factors that have produced an unpredictable outcome. Major gaps in gender and education are the primary upsets that contributed to Trump’s won against Clinton. While more post-graduates voted for Clinton, an overwhelming amount of people without college degrees, voted for Trump. Many middle class constituents have justified voting for trump based on how they have been affected in the workforce. With a high number of white male voters casting their voice against the establishment, this has resulted in electoral college votes in more rural regions to count for more than the urban regions for example Wyoming in comparison to California or Nebraska vs. Maine. Only states that represented clear population unlike others can win by 1 vote for certain political parties in the electoral college. This causes ones vote in Wyoming to be 3X more important than California. This implication has fed the narrative of, “Real Americans live in rural states.” Their votes emphasizes the narrative of the real America with land owners having more stake. Rural states can win electoral college with 44% of the population.
The Electoral College was originally derived from southern states 3/5 compromised vote where states don’t get disenfranchised from the system with the majority of the labor force made up of slaves. With slaves making up a large part of their industry, this was a conservative way to consolidate the votes of the confederation of states. We see how evident this is with the majority vote belonging to Hillary Clinton and the densely populated cities, with a higher rate of college graduates, minorities, and many other factors that play into the results. On the contrary, there was a shocking number of black votes that Trump still gained with 88% and 8% in comparison to Obama’s win with 98% back in 2012. In addition to this, the amount of women that voted for Trump was much closer than I would have expected. There was still a huge gap in comparison to male voters for trump, although there was still a fair amount of woman who could have given their votes to Clinton had they not voted for third party candidates.
I would be curious to see the results of the election has Bernie won the democratic nominee because there was a large number of voters that were still undecided days prior to the election. Also, there was a substantial amount of voters that Pew Research indicated to have believed the economy is in a poor state when there have been many scholars and studies that have said it is improving and growing regardless of the trade deals that Trump blames the establishment for. The alt-right movement was a huge part in the growing phenomenon behind Trump. All in all, the outcome of the election was extremely disappointing. If we look at voting alternatives to the electoral college, we may see avenues in the popular vote, or redistributing powers and weight for the urban areas in comparison to the rural regions.
Excellent
The most striking story revealed from the myriad graphs and cartograms providing feedback about the US Presidential election debacle is from the NY Times. More than halfway down the survey, the question asked was, “Feelings about how the federal government is working.” Of those who were enthusiastic that the government was working well (top tier,) 78% were Democrats. In the next tier, “satisfied,” 75% were Democrats. A corollary to this question, the earlier one on the conditions of the nation’s economy, had very similar responses. Eighty-three and seventy-six percent, respectively for the positive responses that the country is doing either “excellent” or “good” economically, came from Democrats.
It is common knowledge, by those who study these things, that poor, white Americans tend to be both less educated and conservative. These less educated, conservative Americans were not happy with how the government or the economy is going. This is validated in the same NY Times survey under Education level: of the people with only a high school education or less, more than half were Republicans. It is also reflected in the question “What should happen to the illegal immigrants working in the US today?” This question specifically states that it is referring to people who are working. Yet 84% of Republicans want to deport them. Obviously they haven’t given any serious thought to the economic consequences of deporting a large segment of the working population. It’s not like those jobs would immediately be filled by “real Americans” (their term) since the unemployment level today is less than 5%. The people who argue to deport are apparently not able to make that connection.
It has also been shown that people in this group of less educated, conservative, poor white Americans have greater respect for the opinion of authorities and feel more comfortable in a rigidly hierarchical social structure. These people are acting, not from intellectual considerations but from deep-seated, misplaced xenophobia promoted and endlessly repeated by TV and radio personalities, random fake news bloggers and the politicians and ministers whom they deem “authorities.”
The problem is that the Democrats who raved that the economy was doing well, and that the government was working as it should, are primarily urban (as seen in the Politico Presidential Election 2016 map, and also Mark Newman’s cartograms, particularly the county-level election returns) and wealthy. While they may not see themselves as wealthy compared to the many billionaires running the country, they are nonetheless doing well enough that they perceive the economy as working and the country as going in the right direction. Their preferred term is “comfortable.” These people still see themselves as struggling. They are very much aware that they are not the Trumps, the Clintons, the Bushs, the Kardashians. And they failed to recognize that fully half the country is faring far, far worse than they are.
The Pew Research Center’s Fact Tank article, “Are you in the American middle class?” claims that (if one repeatedly tries different numbers) the middle class for a single person in Arkansas is between $22,000 and $66,000. Although any of the notables listed above would, and has, spent the upper end of that range on a single party or event of one evening, I would argue that making 3x what another person is making –in the same community– should put one in a different category altogether. So one of the roots of our country’s spiraling slalom into chaos is that already the gaps between incomes and resources are logarithmic rather than linear as they are so often represented. We fail to recognize this, as a country. In terms of the election, Hillary’s supporters failed to realize that the median household income of the entire US is roughly $52,000 as of 2015 (US Census.)
If one is trying to support a family anywhere in the US on a household income $52,000/y it is very evident that our nation’s economy is not “excellent” and the government is not “working well” for you. If you are a white man trying to support a family of four on only your salary of $52,000/y and you watch television, read (or glance at) magazines, or walk outside your door with your eyes open and see the wealth around you; if you are a white man trying to support a family of four on only your salary of $52,000/y and your expectations are that you will send both your children to college, have leisure time, own leisure “toys” like boats, 4-wheelers, RVs, cabins in the woods and the means to spend time there, that your children will have all the electronics that other teens have, participate in all the sports and auxiliary activities that other children do, that each of you will have your own vehicles and have clothes of sufficient quality and vogue to withstand the scrutiny of our increasingly stratified society with self-assurance, then you are angry. If, as is so often the case, your household income is $52,000 but that is the combined income of your labor as well as your wife’s, and you are struggling to provide all of the above, you are angry. If, as is frequently the case, your household income of $52,000 is the combined efforts of your two jobs and your wife’s two jobs, and your expectations, whatever they once were, are moldering alongside the small aluminum fishing boat you bought out of college when you were 22 which now sits in your .25 acre backyard next to the used 10 speed that your 14 year old was embarrassed to ride, and your kids think you’re a loser because they can’t compete with their own peers and mostly because they never see you anyway, you are angry.
These are the people who voted for “change.” This is reflected in the NY Times article’s category “Most important candidate quality” where “can bring about needed change” was the decision making factor for the 83% of the Republicans who chose that answer. Neglecting the realities of these people is where the Democrats failed.
Sure, a recent interview on NPR disparaged this view, claiming that the majority of blacks are also working class (a euphemism for the desperate end of the broad “middle class” category), yet voted overwhelmingly Democratic. This statement was made as an attempt to suggest that it was a mistake to claim that Hillary did not get the working class vote. Yet, this is to ignore that blacks make up only 14% of the population of the entire country; of that, 10% fewer black voters bothered to vote in this election as compared to the Obama election, and of those who did vote 5% fewer voted Democratic than in the last presidential election. So while indeed, many working class African Americans may have voted for Hillary, their vote as *working class* voters is not significant. As African Americans who could have voted but didn’t, the much lower percentage of the “black vote” may have hurt Clinton, especially in swing states.
In terms of working class Hispanic and Latino voters, the fact that roughly 30% voted for Donald Trump (NY Times) is huge and possibly speaks to whether or not each voter saw themselves first as Hispanic/Latino and thus disparaged by Trump, or as working class and, like the whites, ready for change.
Religion played a role. As authority figures, zealous fundamentalist Christian ministers and religious leaders were able to incite nearly all of their flock to misogyny and fear of Muslims and Mexicans. Age played a role as older people are typically more conservative and far more likely to vote than younger people. And ultimately, the Democratic party itself played a role in that they had a candidate who appealed to youth and was drawing them to activism in record numbers, who wasn’t female and so did not incur the wrath that befalls a woman running for office just for her gender, and even appealed to large numbers of people who simply wanted to see a “change” in our government’s status quo, but the Democratic party refused to support him.
In the end, Clinton’s stance of “more of the same” was the clincher which undermined her campaign. The numbers of Americans unhappy with “more of the same” was vastly underestimated by the Democratic party. And they lost.
Very thorough.
In the 2016 US general election between Donald Trump and Hillary Clinton, Trump won with gaining more electoral votes overall. However, as the cartogram shows, Clinton held more votes in the general popular vote and in the more populous regions of the United States. The more rural parts of the country and less populous regions voted for Trump. Overall there are many trends depicting why Trump overall won the vote.
Compared to Mitt Romney, who lost by a slim margin in the 2012 election, Trump won a similar voting spread of White Non-Hispanic voters of 21 to 20 points. However, Trump did better among minority groups than Romney did, and then Clinton did in this election. Clinton only had an 80-point advantage with the Black vote compared to Obamas former 87-point lead. The lower turnout for the typical democrat stronghold ended up hurting Clinton and helping Trump succeed. Clinton would also not fare as well with the Latino vote compared to how Obama did when he ran for office. This could be due to many reasons like voter suppression and the fact that many people wanted someone “outside the establishment”. Another trend found between the two candidates was that women voters favored Clinton and male voters favorited Trump, following party lines of historical voting, and perhaps due to those genders feeling that the candidate represented them. Women tend to vote more on the left side of the spectrum, and having a woman as president would help promote their values and ideals.
An interesting find was the religious aspect within the voting results. While it is typical for protestants and evangelicals to vote for conservative candidates, it was a little surprising to see the high percentage of voters for him. He is not that socially conservative, but definitely economically conservative, which is probably more important to those of the conservative faith. The catholic vote is historically the swing vote, and for the 2016 election it voted in favor of Donald Trump. Catholics tend to vote either along personal liberty or social justice, and it seems that personal liberty won the election which could be due to Trumps rhetoric of smaller government and cutting taxes and the Affordable Care Acts cost increase. All these things could have helped Trump when the swing vote. What would have been interesting to see would be how Latino Catholics would have voted. While they are known to be more liberal, perhaps with this election they voted for the republican candidate.
good discussion.
The 2016 election is one that I believe will puzzle political scholars for years to come. They will ask questions like, “why did America elect a reality star?” and, “how did someone so blatantly nationalist in rhetoric gain so much traction?”. People will point to an extreme appeal to white male voters, but that doesn’t tell the whole story. These election results may not point to the underlying psychology behind the voting, but it does nonetheless paint an interesting picture about demographic voting in America, and the electoral system.
So let’s start with the first franchised demographic in America: White males. You see a lot of rhetoric being tossed around about how Trump won that goes along the lines of, “Trump was able to appeal to white male voters in historic fashion”. Maybe this line is tossed around because of Trump’s “questionable” statements about everyone who wasn’t a white male: women, minorities, etc. But looking at both the New York TImes and Pew Research shows that while white male voters did have about a five percent shift in voting republican, the margin for Trump was about the same as Mitt Romney’s margin in 2012. So what did happen?
Well that data shows that Trump was able to garner a larger minority vote from every group when compared to the previous election. We saw as much as an 11% shift in minority voting in some demographics(asian), and an 7% and 8% shift in black and latino voters, respectively. Regardless of this, the black vote was still 88% democratic, and other minority populations well over 50% democratic. Even without winning these demographics, Trump seems to have capitalised on swaying large numbers. The reason for this may be a combination of the lack of a racial minority candidate that saw strong support like Obama, or dissatisfaction with a democratic status quo that has been in place for the past 8 years(regardless of the issues Obama has faced in the House and Senate).
It seems Clinton’s biggest strategic advantage did her very little benefits. SHe aggressively pursued the female vote, and while she did lead Trump by a 12% margin, she say only an increase in 1% from 2012 Obama numbers. What does this mean exactly? It likely points to fact that women already voted strongly democratically, and despite her aggressive gender campaigning, did not sway those women who don’t.
One of the Trump’s most significant gains was among the poor, those under $30,000 income. In this demographic, Trump gained a 16% increase over Romney, but still trailed to Hillary in that category. Rural/Urban voters were not too surprising, essentially inverses of each other 60/35 splits. Education over all skewed heavily in democratic favor, but despite this white voters, even educated, preferred Republicans by a 4% margin.
The final point I think you have to address when discussing an election, whether made irrelevant by the electoral system or not, is the popular vote. Hillary Clinton won the popular vote by almost 2.8 million votes. This is not an insignificant number regardless of our voting system, in fact that number was about 2% of the overall votes cast. Another issue is what to do with this information. In light of this should American’s storm the castle, overthrow the new King? Should they seek legal recourse and reform through campaigning for an amendment? Should they do nothing and simply learn hot to play the electoral game better? There doesn’t seem to be a clear answer for this, but in a nation as divided as we are now, drastic measures might be dangerous.
Very nice analysis
The 2016 presidential election results did come as a shock, especially for one such as myself who had believed the predicted polls. Unfortunately, the predicted polls cannot always factor in unexpected outcomes. Such was the case last month. Polls, at least the ones I was looking at, showed Hillary Clinton in the lead. While Hillary Clinton may have been leading among minorities and women, Trump got his ‘trump’ card (I apologize for the pun) from white voters. An overwhelming support system of white voters. Considering America’s election system, a majority of white voters is what Trump needed. The rural states, where a vast number of whites live, provided the gateway for a Trump win.
Yes, race played a large part in this election. Trump won the white vote by a 21% difference. Yet, he lost every other race to Clinton. If you factor in the fact that about 64% of the U.S. population is white.1 When analyzing this, I took into account the white population in America, which totals close to 198 million. However, only a small margin of the U.S. white population including other races, actually voted. This is understood by the popular vote, which Clinton leads by 2.8 million. The fact that Trump has won the election, despite having lost the popular vote, by a such a wide margin puts into question the influence the white vote has.
Then again, the influence the rural white vote has, is much more of a ‘problem’ with our system than their own work. In an effort to level the playing field, so to speak, less densely populated areas were given a significant edge in terms of electoral college votes. With this, a stringent of rural states would total the same number of votes as a state such as California. While this system generally works, it has never been so much of an issue as it is now. The popular vote has never had so much of a difference. There are close to 3 million more people who voted for Hillary Clinton. This means that the majority wants Clinton as president, but the electoral system established back 200 years ago prevents this from happening. It is this electoral college that complicates things. As you can see from the picture above and the corresponding site, you cannot factor in every individual vote as only the votes from the electoral matter. Even though a state may go red or blue, that does not mean every county in the state voted either red or blue. States that go red or blue simply mean that more people in that state voted red or blue. It is this that matters, not the overall country’s opinion, but the opinion of the states. The elector vote will typically follow that of the state’s decision.
Other than race, another demographic factor is the education level of voters. Among white college graduates, Trump won, though not by as wide of a margin as Hillary with non-white college graduates. On the other hand, Trump had also won the vote of whites without a college degree by a wider margin than those with degrees. Not surprisingly, Trump won the states with the lowest rank when it comes to educational attainment.
It has to say something about our electoral system when the U.S has an eligible voter population of about 231 million and only 62,802,2372 people voted for Trump, yet he still wins.
1. https://www.census.gov/quickfacts/table/PST045215/00
2. http://www.cnn.com/election/results/president
3. http://www.nytimes.com/interactive/2016/11/08/us/politics/election-exit-polls.html?_r=1
Excellent discussion.
The 2016 presidential election ended in a surprise outcome with a Trump victory and will be studied extensively for years to come. Many demographic variables came into play leading into election day and after the released exit polls and cartograms, there are five contributing factors that stood out due to either voting gaps or an increased/decreased performance in a candidate. These were votes based on race, gender, education, age, and location. This data comes from exit polls published by the New York Times, research and analysis by pewresearch.org, and election maps produced by Mark Newman at the University of Michigan.
Viewing the exit polls, Trump won the white vote, while Clinton won the hispanic, black, and other votes. The percentage of white voters won by Trump are near identical to Romney in 2012 and percentage of Hispanic and black voters for Trump were slightly higher than Romney as well. Pewresearch.org suggests that the percentage increase for Trump was not one of the defining factors in his victory but Clinton’s large decrease in the percentage of Hispanic and black voters. Clinton had an 80 point advantage compared to Obama’s 87 point advantage in 2012 and 91 point advantage in 2008. (Tyson) The other voting category that Clinton underperformed was in age. While Trump won voters that were older ranging from 45-64 to 65 and over, his percentage points were very similar to Romney in 2012. Although young voters preferred Clinton, with a margin of 55%-37% (Huang), the point advantage decreased from Obama’s 60%-36% in 2012. (Tyson)
The two larger voting gaps are within the votes by gender and the votes by education. In the gender gap Clinton won the female vote by a twelve point margin while Trump won the male vote also by a twelve point margin but also doing seven percentage points better than Romney in 2012. In the education gap Clinton won college graduates with a nine point margin while Trump similarly won non-college graduates by an eight point margin. Both of these gaps, gender and education, are some of the largest in recent elections since the 1972 election for gender and the 1980 election for education. (Tyson) These gaps support how strange this election was and the further need to study the results.
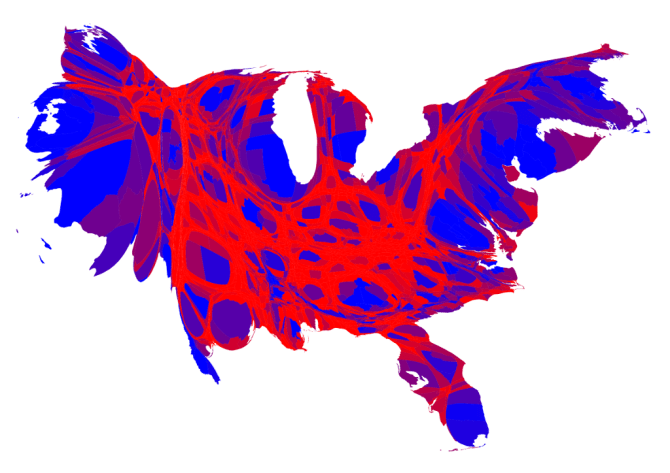
The polls by residency show that in cities over 50,000, Clinton won 59%-35%, in suburbs, Trump won 50%-45%, and in rural areas, Trump won 62%-34%. (Huang) Viewing a normal election map these results are not seen because the state is colored with only the majority vote. To see these results, not only does the map need to show counties, it also needs to be in the form of a cartogram, in which the sizes of states are rescaled according to their population but also the states need to be rescaled with their electoral college factor as well. An example of this type of cartogram is shown in this blogpost with three colors, red(republican), blue(democrat), and shades of purple in between(to indicate percentage of votes). (Election Maps) This cartogram compared to a normal election map enables the viewer to see how close the election really was as the blue color is more prominent in this map because of the larger population in those areas.
“Election Maps.” Election Maps. Mark Newman, 2 Dec. 2016. Web. 13 Dec. 2016.
Huang, Produced Jon, Samuel Jacoby, Michael Strickland, and K. K. Rebecca. “Election 2016: Exit Polls.” The New York Times. The New York Times, 08 Nov. 2016. Web. 13 Dec. 2016.
Tyson, Alec, and Shiva Maniam. “Behind Trump’s Victory: Divisions by Race, Gender, Education.” Pew Research Center. N.p., 2016. Web. 13 Dec. 2016.
Excellent discussion.
The 2016 election has had surprises every few weeks of the campaigns. Predictions were wrong, media blew things out of proportion, and the outcome shocked the nation. The end results left Republican candidate Donald Trump won the election with 306 electoral votes and 62,792,756 of the popular vote (46.3%) while Democratic candidate Hillary Clinton with 232 electoral votes and 65,431,654 of the popular vote (48.2%). This is only the fifth election in which the winning candidate won the election but lost the popular vote. One thing to note is Clinton won the popular vote in very densely populated areas (approximately 50,000+) while Trump mainly received votes from low population states. The number of states that voted democrat is significantly lower than the number of states that voted republican. This means that the red states were able to decide the outcome of the election despite the large cities with high population that voted democratic. This results in certain states such as Nebraska or Montana electoral vote having a bigger impact than states such as California. There are, however, a number of other factors that contributed to the final outcome and the demographics can give some interesting analysis.
This election’s demographics are very reminiscent of the past few election Obama v. McCain (2008) and Obama v. Romney (2012) in a number of ways. Trump won the white voter margin by 21 points from Clinton (58%-37%) while during the 2012 election, Romney won the white voter margin by 20 points from Obama (59%-39%). Among black voters, Clinton had an 80 point advantage (88%-8%) which mirrors the 2008 election with Obama having a 91 point lead and the 2012 election with an 87 point lead. Another demographic that can be mirrored is the gender vote. Clinton was supported 54%-42% while in 2012 (55% Obama vs. 44% Romney) and 2008 (56% Obama vs. 43% McCain). This is an interesting pattern to be observed across the past few elections in regards to race and gender.
Education, the minority vote, and religion are several fascinating contributors to demographic analysis. College graduates supported Clinton by 9 points (52%-43%), while those without a college degree supported Trump by 8 points 52%-44%. This is the widest gap in the exit polls of support among college graduates and non-college graduates since Reagan v. Carter 1980. These statistics can be broken down even further. Trump received 67% of the non-college white male vote and 49% of the college while male vote. Clinton, however won 71% of the non-white voters with college and 75% without. The minority vote also yields some interesting results. Trump won the majority of white voters while Clinton won in every other demographic including Black, Asian, Hispanic, and others. As far as religion goes, Trump won the majority of white-male christian and catholic voters while Clinton won every other demographic, especially the Jewish and non-religious community.
The 2016 yielded some interesting data that offered a few surprises and contradicted several predictions. Each of these, and countless others, played a integral role in the outcome. This data is very informative, but it is always a good mentality to be cautious of this data as it does not contain the complete voice of the nation. It lacks absentee ballots, could potentially have poor data collection, or items of such sort.
Excellent discussion.
The outcome of the 2016 came as a surprise to many. Clinton ran a campaign that was “stronger together” and banked on the support of the liberal elite and minority demographics, but ended up underperforming in key areas needed to win.
Clinton supports and the media’s narrative clearly underestimated the influence of certain demographics and underperformed in areas that won Barrack Obama the elections previously. Trump did remarkably better than predicted and won the majority of white rural votes in areas overlooked by Clinton. Trump also had a higher percentage of voters of black and Hispanic than Romney did, while Hillary Clinton did not run as strongly, scoring 88% of black votes compared to Obama 90’s% support in earlier elections. In terms of gender Hillary did win the majority of women voters but not by margins intended, another demo Barrack polled better in. Trump won male voters within the same margins, but was higher than Romney’s, another area of improvement. Trump also won the majority of white without college degrees by the largest margins sine 1980, 67% to 28%. Over all education demographics show that Trump won both white college graduates and without a college degree and Clinton won nonwhite college graduates and without college degree. When looking at the data you see a clear race gap between voters. While Hillary scored better among young, overall educated, minority, female, lower income voters; Trump won amongst the 45 and over, white, rural, majority income voters. Trump secured the rural silent majority vote, as well as improving the margins that Romney had. Hillary focused her campaign in particular areas that paid off, but overall did not achieve the amount of support she thought and underperformed compared to Obama’s numbers.
An increasing phenomenon in the United States election process is that although Trump won the election by Electoral College, Hillary won in popular vote. Since this came out many American are outraged by the outcome and have proposed to suspend the Electoral College system, which is an interesting but nearly impossible idea. I think majority of Americans are ready for true change, which is what a wildcard like Trump offered, unlike Hillary who has been part of the system for a long time. Clinton had many worrisome drawbacks such as the negative rhetoric spread by Trump and the email scandal and Clinton foundation fraud, which obviously effected the popular more than the media let on.
Good, if a little brief
This presidential election will go down in history as one of the most unusual we’ve ever had. Blue and red were bolder than ever in some regions of the country, while purple covered others as party lines were clouded, mangled and reconfigured. For many voters, this was the first time they were forced to evaluate their individual beliefs and concerns and compare them to the candidates running. People could no longer punch the easy ticket that typically comes with “registered” Republican or Democrat, instead they had to decide for themselves who they trusted with the responsibility of the Presidency. I believe for many, the largest influence was their background; who they are, and where they are from.
The typical election map displayed through the news is that of the United States divided into the fifty states with proper state boundaries drawn and each state colored red of blue respectively to their electoral college votes but perhaps one of the many other electoral maps that better show the dispersion of voter population is that of the votes by county. A portion in the NE and in the SW are heavily clustered democrat, but otherwise the vast majority of counties republican. Yet the popular vote was split nearly fifty-fifty! This is due to the massive populations congregated in urban areas that tend to be liberal. It may be responsible in part to the larger portions of impoverished folks seeking increased unemployment benefits or federal guaranteed health insurance, but it appears from the demographics that social aspects had more influence. New York Times Exit Polls estimate Eighty-eight percent of the black population voted for Mrs. Clinton (http://www.nytimes.com/interactive/2016/11/08/us/politics/election-exit-polls.html?_r=0). A much larger percentage of Blacks live in Urban areas than White or Hispanic, and this clearly showed in the above statistic. In many states, such as Michigan, those of us watching the election results live could do little to estimate the outcome because although nearly every county had been accounted for as vast majority for Trump, these rural counties of relatively small populations could be overturned quite easily if Detroit turned out Liberal enough.
The largest discrepancy from previous elections in recent history was the amount of distrust and anger present in voter decision-making. A massive portion of Trump supporters (especially early on in his campaign) cited their anger against the political system and its inefficient “correctness” as their biggest motive for pushing for Mr. Trump. Between their “Hillary for Prison 2016” posters and “Make America Great Again” slogan, it is clear that many were tired of the untouchable and slow federal policies and inner workings that they feel is holding the country back. On the Liberal side there were (in my opinion) even more topics of rage and fervor on the minds of voters. Trump was widely believed to be racist, chauvinistic, sexist, egotistic, brash, foolish and dangerous by many across the board. I know women who believed that many male voters were sexist and just wanted Hillary to lose so a woman would not make it to the White House, so they tried rallying friends to vote to counter them. He offended many people of various racists, beliefs and sexual preferences while all the while pleasing many by proving he meant too much business to focus on political correctness and hurting feelings.
Whoever they voted for, very few were perfectly confident in their choice, so for the next several months the globe is finally united under one thing: whether white, black, orange, liberal, conservative, American, Russian, Earthling or Alien all fingers are crossed!
Good discussion.
Blog 4 Election Results
I think the most telling portion of these election results are the maps provided by Mark Newman. The electoral map show the power distribution of lessor states vs that of the larger states but because the win does not indicate the quantity it is misleading at the state level. It does help to examine the population cartogram though because it does help the viewer to see the distribution more accurately. The increased size of some of the least populated states when adjusted with the electoral votes is also important because it shows the influence of the votes in these states.
The map that shows voting at the county level and has a gradation is probably the most revealing of the country. These majority republican vote states are very purple in the outlying areas far more so than the electoral vote shows. The same holds true in Eastern Washington, Oregon, and Northern California. These areas are very rural and are dependent on agriculture or timber.
This brings us to our election results where we see that white, rural, males and some females voted overwhelmingly for Trump. Many of these people are older and more established and therefore are least likely to want change and most like to harken back to a “lost era”. There have been outcries of how this is just ignorant racist whites who long for the good old days of segregation. We have seen a rise in actions by people with this mentality but is this the main reason for the whites favoring Trump?
Rural Americans have a limited access to a wide variety of media. In some cases, internet is not available and in others TV or cable options are also limited or non-existent. If these people only have limited access to news which is heavily laden with half-truths and propaganda are they really going to make an informed decision.
A personal example is that where my parents live in a Northern Midwestern state. Locally they have access to two Republican leaning news channels and one Republican leaning newspaper for a regional city. If they want access to the opposite viewpoint they either must seek it out on satellite TV or possibly on the radio. This is not unusual in many rural areas and if those surprised Democrats and Independents want to garner a different outcome in the next election cycle then they need to focus on this problem.
Although there are news sources who share reliable accurate reporting for free on the web, not all people have access to these resources to verify the news. We have seen in the aftermath of the election that a number of voters may have been swayed by fake news stories on Facebook. Other sources point to the FBI statements right before the election. In all of these it seems that the people on any side other than Trump feel that there must have been a mistake.
A lackadaisical vote by younger people and a willingness to overlook character flaws by evangelicals could also be pointed to as reasons that Trump won but even these are only small pieces of the puzzle.
Pew Research has an article that discusses why pollsters were so far off the mark on the election predictions. They look at many of the immediate after voting polls but do not mention early voting. This was a significant quantity of voters in many states and a large number locally. If these people are not being polled especially in states where early voting lasts for many days than how can the data be accurate.
If the Trumpers where shy in their response or if they just chose not to answer the polls they too could have skewed the results. Locally,
“Early voter turnout was at an all-time high, with nearly 48,000 people casting early ballots. That’s about 37 percent of the total number of registered voters in the county.”
This quote was from an article in the Fayetteville flyer. If these results were even remotely typical around the country then how can any post-election poll at the polling station be accurate. In all of the early polling results reported on election day, I do not remember an adjustment being made or mentioned to account for early voting.
Mark Newman, Department of Physics and Center for the Study of Complex Systems, University of Michigan
Updated: December 2, 2016
https://www.fayettevilleflyer.com/2016/11/08/fayetteville-early-voting-results-favor-jordan-marsh-petty-bunch-long/
Excellent
On the morning of November 8th, I pulled up NPR on my computer and saw an article entitled “7 Scenarios for How Election Night Might Play Out.” Of these 7 scenarios, only 2 predicted a Trump victory and even then the author of the article, Domenico Montanaro, called these scenarios the “Trump Squeaker” because of how unlikely he saw them. I read this article and sipped my coffee with confidence in how the night was going to go. Probably because, like most over-politicized and left-leaning people, the media bubble I was living inside of allowed no room for the possibility of a Trump victory in my head. But Trump did not merely “squeak” through the electoral college that evening, he swept through like a fake-tanned, lousy-hair-pieced banshee and walked out with 306 electoral votes to Hillary Clinton’s 232. Although this entire situation still somehow feels very surreal to me, looking at the data provided offers a much clearer image of how Trump took this country this election.
The 2016 Presidential Election or: How White People Learned to Stop Worrying and Embrace their Racism. Actually, that’s not fair. It’s a real toss-up at this point if it’s racism that’s tearing this country apart or sexism. I think it’s a combination of both. On the New York Times Election 2016: Exit Polls, you can see evidence for my stance. The majority of men (specifically white men) voted for Donald Trump while majority women and minority voters casted ballots for Hillary. Even with the suspected loss of the “Obama Coalition” of voters, Hillary still pulled 88% of black voters versus Trump’s 8%. Basically, the biggest take-away statement from the Time’s results is that “middle-class, middle-aged white people without college educations voted for Trump.” While there is wiggle room there, the statement holds up. In my own personal opinion, I think this will be the last election that that specific demographic is allowed to determine the results of an election.
Mark Newman’s maps offer a great look at the true nature of the standard election results map we’ve all seen over and over. His cartograms are expertly crafted and give a very eerie view of the nature of this country and its voting flaws. The cartogram I’m most interested in from this collection is the one where he broke up the voters by county but created shades of purple with a linear color scale for the counties where voting was more mixed. Then he distorted it based on voting power and population and the results are insane. As you used it as your example, you understand the implications of this visual. The country is a lot more divided and confused than I thought before the election but it’s not like we’re all living in two separate worlds: the country is a massive inter-connected web of voters that are just trying to lead this country in the right direction. While voters are leaning into their respective left/right categories more and more, we’re all still right next to each other which is an image you can’t quite get from the standard “coastal blue/central red” maps that have been used most frequently. I will say, though, just because of my own political leanings that I’m very happy about the amounts of blue and purple I’m seeing as it gives me hope for the next election.
Very nice discussion.
The 2016 presidential result is shocking to most, but once you analyze the data it becomes clear which demographics took place in the election of Donald Trump. Due to detailed voting ballots we are able to collect data and create visual graphics to represent the various demographics associated with this election.
This election showed a jump in voters with only a high school or less education, in which they voted republican. As you can see by the diagram produced by the New York Times, the white demographic without a college degree jumped 14% republican compared to the 2012 election. You can also see that college graduates of all races voted 8% more demographic than in the 2012 election, this is possibly due to the rise in student debt in America. Education played a key role in the 2016 election, uneducated individuals tend to rely on unworthy news sources and can’t decipher from real or fake news articles and this is evident in both parties.
Age played a crucial role in this election because the younger generation was not enticed to vote, to them the election seemed pointless and boring. Most of the news that the younger generation believed to be true came from unreliable sources that are usually posted on social media and are able to bend the truth without lying. It is evident that most of the young voters didn’t even cast their vote at least compared to the 2012 and 2008 election. After Bernie Sanders was eliminated from the race a lot young democrats lost the urge and instead of collaborating for the greater good they decided not to vote for any of the candidates and prey for the next four years to go fast. They wanted change well they got it.
One thing that baffled me about the data presented by the NYtimes was the jump in the Republican voters that had incomes less than 30,000 dollars. According to the data there was a 16% jump in the republican voters that live in poverty. I am assuming that they are poor Caucasian individuals that live in rural areas of their state and collect benefits from the government but I could be wrong. I understand that President Trump promised more American jobs to which these people have lost due to technological advances and overseas industrialization, but the fact that Trump has even said that he wants to reduce of some of these government programs that these individuals rely on shows that they are uneducated on the news they are receiving. This just shows that education plays a crucial role in the election process.
There was a 14% jump in republican voters that have some college/associate degree since 2012 election. Most of these individuals are a part of the middle class so this is an interesting jump, it could possibly be due towards their belief that there aren’t enough jobs in their area. Whatever the reason is behind this spike in the republican party vote, it all comes back to the fact that education played a key role in the 2016 election of Donald Trump.
Very good discussion
The 2016 US election had different outcomes in several different aspects. Its results showed clearly how Hillary Clinton’s voice did not quite reach the two most predominant racial groups after the whites—the African Americans and Latinos. If the results of the 2016 elections are compared to those Obama obtained in 2012, Hillary Clinton Clinton obtained less support from the African Americans.
According to Pew Research Center this is the fifth elected United States Presidents to have won the elections without winning the popular vote. My perception about people coming to the realization about the role of the electoral college was more noticeable for this election. People might not have noticed about the occurrence of this phenomenon and the role of the electoral college because of the frequency in which it has occurred in the past and how much it was at stake this past election.
I am not sure about people’s reaction to having witnessed an elected president who won the electoral college and lost the popular vote and the different types of opinions regarding national security, economy, education, minimum wage, taxes, immigration, etc. at that time. Nonetheless, something that was very noticeable were the different angles at which these issues were approached by Democrats as well as by Republicans for these past elections. There was a huge and a very radical gap while approaching the topics included in the political agenda for this year’s elections. Both parties’ proposals offered very radical solutions. One of the candidates offered immigration solutions such as building a wall to avoid more people from coming and the other one more flexible measures to work with those immigrants that were in and the ones who were planning on coming. This example exposes the magnitude at which each one of the candidates and political parties differed on finding common ground in their political agendas. It’s more like saying hot or cold and the not existence of solutions in between. I am convinced that that sense of radicalism had a lot to do on the outcome of these past elections.
We have been able to notice how the different agendas from different candidates have changed over time. From agendas that go from supporting more women in the senate, to agendas that promote that women are equal in the 60’ and that women also have the right to have equal wage. The high number of migrants have forced politicians to make more emphasis on including migration into the political agendas. District boundaries have had to be modified because of the variations and changes in the population.
By looking at the 2016 presidential election outcomes, we are able to confirm that we humans are in constant change and that every time frame has different dynamics on the interaction of humans and political agendas. These political agendas will be seen by people at different angles and each individual will give approach them differently– therefore the reason why each election has different results.
Excellent